Building a Homelab Agentic Ecosystem (Part Two) ... with Google ADK
Level up your homelab with a true multi-agent AI. Using Google's ADK, I build an agentic ecosystem with a central coordinator that directs specialists to query Kubernetes, Prometheus, and more. A deep dive into creating a smarter, automated infrastructure.

In the first part of this series, we laid the groundwork for a smarter homelab, building a local-first, LLM-powered agent capable of understanding and responding to natural language queries about our infrastructure. We successfully created a system that could directly interface with Prometheus, Kubernetes, and Harbor, providing a streamlined way to get information without relying on cumbersome dashboards or cloud-based services.
Now, in Part 2, we're taking a significant leap forward. Our goal is to evolve our single-purpose agent into a more sophisticated, agentic platform. This means moving beyond simple question-and-answer interactions to a system that can reason, plan, and execute multi-step tasks.
To achieve this, we'll be diving into the Google Agent Development Kit (ADK).
The ADK is a powerful, open-source framework designed to build and orchestrate complex AI agents and multi-agent systems. It provides the tools and structure to create specialized agents that can collaborate to achieve larger goals. By leveraging the ADK, we'll transform our homelab assistant into a dynamic team of agents, each with its own role, working together to manage and interact with our infrastructure in truly intelligent ways. Get ready to explore the exciting world of agentic AI as we take our homelab to the next level.
Building an agent
Building an agent is actually pretty straight forward and essentially consists of 3 things:
- A prompt
- Tools (or functions)
- A large-language model (LLM) that supports tools to chat with
All we need to do to get started is leverage pip and install the google-adk package...
pip install google-adkNow we have the libs available, converting our previous prometheus tool is super simple and we get something like:
"""prometheus_query_agent: for getting metrics and data from prometheus"""

import json
from prometheus_api_client import PrometheusConnect
from google.adk import Agent
from google.adk.models.lite_llm import LiteLlm
from config import settings
from . import prompt

# Configuration
PROMETHEUS_URL = settings.prometheus.url

# Tool Functions

def run_promql_query(query: str, **kwargs) -> list:
  """
  Executes a PromQL query against the homelab Prometheus instance and returns the raw, structured result.
  Use this to answer any questions about system metrics like CPU usage, memory usage,
  or network traffic. For example, to find average CPU usage, you could
  formulate a query like 'avg(rate(container_cpu_usage_seconds_total[5m]))'.
  """
  print(f"--- TOOL: Running PromQL query: {query} ---")

  if not PROMETHEUS_URL:
    return [{"error": "PROMETHEUS_URL environment variable is not set."}]

  try:
    pc = PrometheusConnect(url=PROMETHEUS_URL, disable_ssl=True)
    result = pc.custom_query(query=query)

    # If the query returns no data, return an empty list.
    if not result:
      return []

    # Return the raw, structured list of dictionaries from the client.
    return result

  except Exception as e:
    # Return the error in the same structured format (a list with a dict).
    return [{"error": f"Error running Prometheus query: {e}"}]

# define an llm and root_agent

llm = LiteLlm(
  model=gpt-4.1,
  api_base=https://api.openai.com/v1,
  api_key=sk-proj-...
)

root_agent = Agent(
  name="prometheus_analyser_agent",
  model=llm,
  instruction=prompt.PROMETHEUS_ANALYST_INSTRUCTIONS,
  output_key="prometheus_analyser_output",
  tools=[run_promql_query]
)
What we basically have here is a single function that allows queries to be executed against the prometheus endpoint (same as we had in part one) but we have a new section at the bottom that creates an agent and connects it to an LLM... this however is a super simple single agent usecase which isn't quite were we want to be...
For the homelab ecosystem we could potentially end up with 10-30 different tools for the LLM to choose from ... this requires something a little bit more complicated ... but luckily not much more complicated ... we need a coordinator 😄
Agency architecture
So to build our Eternium agency we can map out our initial set of agents and understand how they connect to the relevant services, this is a little different to part one but the overall essence is the same and looks as follows:
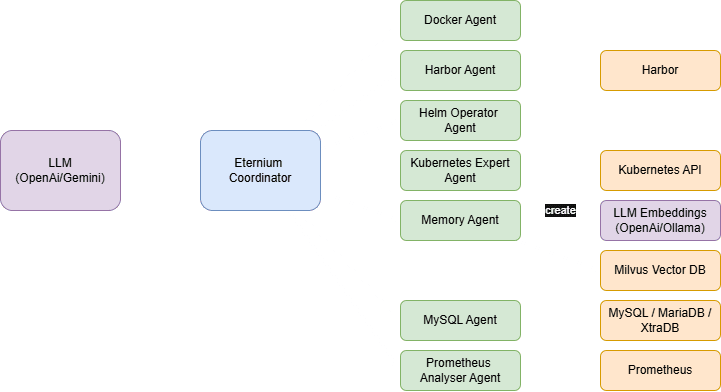
The key difference here is that we introduce a coordinator into the mix that will essentially work as a mediator between the LLM and the agents that we build. The agents, still manage their own connections to the external services and can be configured to pretty much do anything we need to do.
The challenge I faced here was being able to find a good enough LLM that I could host which supported tools, none of the one's I tried (phi4-mini:latest, qwen3:8b and mistral:7b) worked well with this framework so I settled on OpenAI until I figure out the local model hosting side of things ... that being said running the mxbai-embed-large:335m ollama model works well for the memory embeddings but OpenAI is an option here too.
Building the agency
So, now we have a rough idea of what to build ... let's go!!
📂 Code Repository: Explore the complete code and configurations for this article series on GitHub.
First off, we create the following structure:
$ tree .
.
├── config.py
├── eternium
│   ├── agent.py # primary coordinator and agent loader
│   ├── prompt.py # coordinator and tool delegation prompts
│   └── sub_agents # folder containing the tools
├── main.py
├── requirements.txt
At the top level, we have a config script that leverages pydantic_sessings to build a settings object that can be used across the project, we have the main entry point and a pip requirements file to simplify future installations. The other thing we have is the eternium folder which is our main agent.
The main.py script is simply a FastAPI endpoint that, for simplicity, exposes the Google ADK web interface, a familiar chat UI with debugging/trace capabilities.
import os
import uvicorn
from fastapi import FastAPI
from google.adk.cli.fast_api import get_fast_api_app
from config import settings

AGENT_DIR = os.path.dirname(os.path.abspath(__file__))

# Call the function to get the FastAPI app instance
app: FastAPI = get_fast_api_app(
  agents_dir=AGENT_DIR,
  session_service_uri=settings.app.session_db,
  allow_origins=settings.app.allowed_origins,
  web=settings.app.serve_web_ui,
)

# Simple health check endpoint for Kubernetes liveness/readiness probes.
@app.get('/healthz', status_code=200, tags=["Health"])
def health():
  return {"status": "ok"}

if __name__ == "__main__":
  uvicorn.run(app, host=settings.app.host, port=settings.app.port)
We add a healthz endpoint for Kubernetes when we deploy it later 😉
Now, we dive into the agent folder... the main coordinator is the top level agent.py script and essentially looks like:
"""
This module contains the factory function for creating the main Coordinator agent.
It dynamically assembles the agency based on the enabled agents.
"""
import importlib
from google.adk.agents import Agent
from google.adk.tools.agent_tool import AgentTool
from google.adk.models.lite_llm import LiteLlm
from config import settings
from . import prompt

llm = LiteLlm(
  model=settings.llm.model,
  api_base=settings.llm.url,
  api_key=settings.llm.token
)

AGENT_BLUEPRINTS = {
  'docker':     {'prompt_snippet': prompt.DOCKER_DELEGATION_RULE},
  'harbor':     {'prompt_snippet': prompt.HARBOR_DELEGATION_RULE},
  'helm':       {'prompt_snippet': prompt.HELM_DELEGATION_RULE},
  'kubernetes': {'prompt_snippet': prompt.KUBERNETES_DELEGATION_RULE},
  'memory':     {'prompt_snippet': prompt.MEMORY_DELEGATION_RULE},
  'mysql':      {'prompt_snippet': prompt.MYSQL_DELEGATION_RULE},
  'prometheus': {'prompt_snippet': prompt.PROMETHEUS_DELEGATION_RULE}
}
available_agents = []
enabled_agent_rules = []

print("Assembling agency...")
for agent_name, config in AGENT_BLUEPRINTS.items():
  if getattr(settings.app, f"enabled_{agent_name}", False):
    print(f"  - Enabling specialist: {agent_name}")
    try:
      module_path = f".sub_agents.{agent_name}"
      agent_module = importlib.import_module(module_path, package='eternium')
      factory_function = getattr(agent_module, f"create_{agent_name}_agent")

      # The worker agent is created with the same llm
      agent_instance = factory_function(llm)

      available_agents.append(AgentTool(agent=agent_instance))
      enabled_agent_rules.append(config['prompt_snippet'])
    except (ImportError, AttributeError) as e:
      print(f"  - WARNING: Could not load agent '{agent_name}'. Error: {e}")
  else:
    print(f"No settngs for {agent_name}")

delegation_rules = "\n".join(enabled_agent_rules)
final_prompt = prompt.COORDINATOR_PROMPT_TEMPLATE.format(delegation_rules=delegation_rules)

# The coordinator is also created with the same llm
eternium_coordinator = Agent(
  name="eternium_coordinator",
  model=llm,
  instruction=final_prompt,
  tools=available_agents
)

root_agent = eternium_coordinator
We leverage the settings from the top-level config.py to manage the various settings but the key part here is we have a known set of agents which have their own prompt snippet, these agents are built and loaded into the coordinator which then leverages the LLM to coordinate a users request with the tools. A tool prompt looks like the following:
KUBERNETES_DELEGATION_RULE = """
1.  **`kubernetes_expert`**
    * **Function:** Handles all tasks related to the Kubernetes cluster itself.
    * **Delegate When:** The user's query involves keywords such as: `pod`, `deployment`, `namespace`, `statefulset`, `daemonset`, `logs`, `describe`, `status`, or other Kubernetes resources.
"""
The coordinator prompt looks as follows and includes the delegation_rules which tells the LLM how to leverage the various tools based on the snippets provided:
COORDINATOR_PROMPT_TEMPLATE = """
You are the master coordinator for 'Eternium', a sophisticated Homelab Operations agency. Your primary function is to receive user requests, diagnose the user's intent, and delegate the task to the single most appropriate specialist sub-agent on your team.

Your goal is to provide clear, tool-driven answers to help the user manage and understand their homelab environment.

Here are your specialists and the rules for delegating tasks to them. Adhere strictly to these rules:

**Your Team of Specialists and Delegation Rules:**

{delegation_rules}

**Your Process:**

1.  Analyze the user's request to identify the correct specialist based on the rules above.
2.  **CRITICAL STEP:** Before delegating to a specialist, first consider if long-term memory might contain relevant context. If the query is complex or could have special requirements, call the `memory_agent` with a query to retrieve any relevant notes.
3.  Call the designated sub-agent with the user's request.
4.  You MUST NOT attempt to answer questions yourself.
5.  You MUST NOT invent commands like `kubectl` or `docker`. Your SOLE RESPONSIBILITY is to choose the correct sub-agent and call it.

---
**CRITICAL: Final Response Generation**

After all necessary tools have been called and you have gathered all the required information, your final and most important task is to synthesize this data into a single, cohesive, natural language answer for the user.

**Your Final Answer MUST Adhere to these Rules:**

1.  **Synthesize, Don't Just Report:** If you used multiple tools (for example, to get a list of pods and then get their metrics), you MUST combine the information into a single, coherent response. Do not present two separate blocks of data.
2.  **Be a Helpful Expert:** Your tone should be that of a helpful, expert Site Reliability Engineer. Address the user directly and clearly present the information they asked for.
3.  **Hide the Machinery:** Do NOT mention the names of the sub-agents or tools you used (e.g., do not say "the kubernetes_expert reported"). The user only cares about the final answer, not the internal process.

**Example 1: User asks "What pods are in the default namespace?"**
* *Internal Thought:* You will call the `kubernetes_expert` and get back `[{{"name": "nginx-1"}}, {{"name": "redis-1"}}]`.
* *Your Final Answer (Correct Format):*
  > The pods currently running in the default namespace are nginx-1 and redis-1.

**Example 2 (Multi-Tool Synthesis): User asks "What are the pods in the 'models' namespace and what is their CPU usage?"**
* *Internal Thought:* First, you'll call `kubernetes_expert` and get the pod list. Second, you'll call `metrics_analyst` with the pod names and get their CPU data back.
* *Your Final Answer (Correct Format):* You must combine these two pieces of information into one summary.

  > Certainly. I found 3 pods in the 'models' namespace. Here is their current CPU usage:
  > * `debugger`: 0.007 cores
  > * `mistral-7b-deployment...`: 0.001 cores
  > * `ollama-me-this...`: 0.0004 cores
"""
The prompts took me longer to build than the rest of the code for all of the sub-agents put together and seemed to produce better results when passed American English 🤔😆
Building the agents
Now we have our coordinator in place, we can start building out the agents that we want to include. Each agent bascially needs:
__init__.py- autoloader for the agentagent.py- main tools fucntions and agent definitionprompt.py- prompt for the agent, this is optional as a separate file but soo much easier to handle, especially if you have a lot of functions in your agent
Similar to the coordinator, we need to include a prompt for the tool which dives more deeply into the capabilities of the agent, the prometheus one looks as follows:
PROMETHEUS_ANALYST_INSTRUCTIONS = """
**Role:** You are a quantitative monitoring analyst specializing in translating human questions into precise PromQL queries.

**Objective:** To formulate and execute a single, syntactically correct PromQL query to answer a user's question about system metrics.

**Input (Assumed):** A high-level question about system performance (e.g., CPU, memory, load).

**Tool:**
* Your only tool is `run_promql_query(query: str)`.
* Your primary task is to **translate** the user's natural language question into a valid PromQL query string to be used as the `query` parameter for your tool.
* **Example Translation:** If the user asks "what is the average CPU usage?", you should derive a query like `avg(rate(container_cpu_usage_seconds_total[5m]))`.

**Instructions:**
1.  Analyze the user's question to understand the specific metric, timeframe, and aggregation they are interested in.
2.  Synthesize the correct PromQL query string that will retrieve the requested metric.
3.  Execute your `run_promql_query` tool, passing the synthesized query as the parameter.

**Output Requirements:**
* You MUST return only the raw, unmodified, structured data (typically a list of dictionaries) that you receive directly from the Prometheus query tool.
* Do not attempt to interpret or summarize the metric data. Your job is to formulate the query and return the resulting data structure.
"""
To make full use of the prometheus agent, the only change we need to make is swap out the agent definition as follows:
...
# rest of the functions
...

def create_prometheus_agent(llm):
  """Factory function that builds and returns the Harbor agent."""
  return Agent(
    name="prometheus_analyser_agent",
    model=llm,
    instruction=prompt.PROMETHEUS_ANALYST_INSTRUCTIONS,
    output_key="prometheus_analyser_output",
    tools=[run_promql_query]
  )
This takes the LLM from the coordinator and creates the "prometheus_analyser_agent" which can then be leveraged by the coordinator.
A key thing to note at this point is that agents can actually use a different LLM than the main coordinator does. This allows for a level of flexibility to use different models that are more suitable for the activities related to the agent. Achieving this is super simple and just a case of definining the various llm settings either at the coordinator level (which gets passed into `create_{agentname}_agent`) or you could build it into the agent file itself... I found it easier to manage at the coordinator level.
For the other agents, we repeat this same structure and build them out the exact same way e.g. to reuse our previous kubernetes tool set we just need to add the following to the bottom of the agent.py file:
...
# rest of the functions
...

def create_kubernetes_agent(llm):
  """Factory function that builds and returns the Kubernetes agent."""
  return Agent(
    name="kubernetes_expert_agent",
    model=llm,
    instruction=prompt.KUBERNETES_EXPERT_INSTRUCTIONS,
    output_key="kubernetes_expert_output",
    tools=[
      get_pods,
      get_deployments,
      get_statefulsets,
      get_daemonsets,
      get_namespaces,
      get_ingresses,
      get_services,
      get_logs,
      scale_deployment,
      delete_pod,
      describe_resource
    ],
  )
And 💥we have an agent that our coordinator can leverage
Pulling it all together
Now we have the coordinator and agents loaded all that's left to do is test it... using either adk run eternium or python main
Either approach will launch a webserver on http://localhost:8000 (assuming your port is 8000) which provides you with Google ADK chat interface where you can start to ask questions to the agency ... a quick demo looks as follows:
Quick chat session with Eternium to demo it's capabilties
From the video, we see the Eternium coordinator checking with the memory agent to retrieve the requried temperature metrics which it then uses to query Prometheus, at teh same time it triggers a call to kuberentes to get the pod information, then it collates all the information and passes it back to teh LLM to produce the final output:
Here’s what I found regarding GPU usage over the past 12 hours:
- The peak temperature observed was 34°C on GPU-5c1417a1-1acc-172d-4de7-5f37d30f10b5 (located on node k8s-gpu-worker05).
- The 'ollama-me-this-6cb858599-cz5xb' pod running in the 'models' namespace is one of the pods utilizing this GPU.
- On node k8s-gpu-worker04, the highest temperature recorded was 30°C for GPU-06ff9950-ed97-542d-3c63-ed3b8fd318f6, which is being used by the pod 'ollama-me-this-6cb858599-69mc6' in the 'models' namespace.
If you need more details about specific GPU assignments or further pod utilization information, let me know!
All in all, a pretty good response and it's good to see my GPU's are not overheating with all this work 😆
Future extensions
The next step I think is to develop more self-actuating capabilities, I'm thinking an alert manager agent so that Eternium can analyse the system and create alerts with various thresholds that if triggered it can respond to e.g. if the GPU's hit 75°C then it can shut down the model pods that leverage the GPU.
The alert manager agent could trigger alerts to a remediator agent which can respond to a number of different alerts e.g. the alert manager detects a "Pod CrashLooping" alert, it passes this information to the remediator agent that would check the pods description, logs, and events to see if a simple restart would solve the problem, if so it would just restart it and then let me know it had done this in an email or something.
If we leverage something in prometheus for the apdex of a service, it could even respond by increasing the number of replicas available until the load reduces (I know this can be done with autoscalers but this could be an alternative).
We could create a report agent that periodically produces reports based on a number of different things happening around the cluster... could hook it into pihole and network metrics to see what the state of the network is.
Wondering if this can be hooked into Google Home or Alexa so it can fill me in while I make coffee in the morning ... 🤔