Bob’s Journey into Application Observability: Uncovering Hidden Threats
Bob dives into Kubernetes application observability, learning how to use logs to monitor performance and uncover hidden threats. With Josie's guidance, he discovers the power of metrics and visualisation tools to keep his apps running smoothly.

Bob had come a long way in his Kubernetes journey. From securing Docker images to locking down Pod traffic with Network Policies, he had built a robust foundation for his applications. But as he watched his cluster hum along, a question lingered in his mind.
"How will I know if something goes wrong?"
Josie, ever ready to guide, appeared with a thoughtful smile. "Good question, Bob. Securing workloads is only half the battle. Observability is how you keep watch over your cluster and applications".
"Observability?" Bob asked.
"It's more than just logs" Josie explained, "It's how you gain a clear understanding of what’s happening inside your system... logs, metrics, traces. Together, they're the eyes and ears of your cluster."
📂 Code Repository: Explore the complete code and configurations for this article on GitHub.
What Is Observability?
Josie described observability as the ability to measure the internal state of a system by examining its outputs.
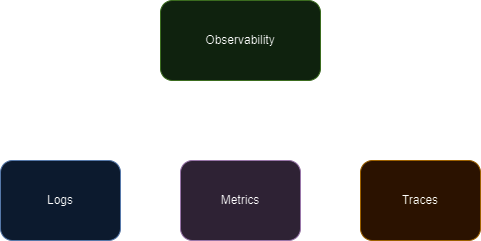
"Think of it as the health dashboard for your application," she explained. "When done right, it helps you detect issues, optimise performance, and even uncover security threats", grabbing her notepad Josie draws out the 3 pillars

Observability rests on three pillars:
- Logs: Capturing granular details about application behaviour
- Metrics: Aggregating key statistics over time, such as request latency and CPU usage
- Traces: Visualising the flow of requests across distributed systems
"Each pillar serves a purpose" Josie said. "Together, they give you a full picture of your application’s health."
Why Observability Matters
Josie highlighted why observability is critical for any Kubernetes deployment:
- Proactive Problem Detection: Spot anomalies like high memory usage or slow response times before they escalate
- Security Insights: Identify potential breaches or unauthorised access patterns
- Optimisation: Fine-tune resource usage and improve application performance
"With observability, you're not just reacting to problems; you're preventing them".
Logs: The First Line of Defence
"Logs are the most familiar to developers," Josie said, pulling up an example on her laptop. "They record detailed information about events in your application, like errors, warnings, and informational messages."
"Logs are automatically centralised by Alex’s platforms team," Josie explained. "For you, it's as simple as checking the logs with kubectl logs -f during development or viewing them in Grafana for a consolidated view of application behaviour. No setup needed!"
Metrics: Watching the Bigger Picture
Josie moved on to metrics, which provide aggregated views of application and cluster performance.
"Grafana is your window into application performance, Bob. You can create panels to monitor metrics like CPU, memory, network, disk usage, latency, and even Apdex scores to measure user satisfaction. These metrics give you a clear, actionable view of your app's health."
Josie opens up Grafana and pulls up an example dashboard:

"Something like this would help you observe how well your app is performing" she says. "It includes, the basic CPU/Memory usage as well as the network traffic/latency and an Apdex rating so you can see how well your app is responding to users ... not very well based on this example 😅"
Traces: End-to-End Visibility
Josie saved the most exciting pillar for last: traces.
"Tracing lets you follow a request through your system," she explained. "It's invaluable for identifying bottlenecks in microservices."
Setting Up Tracing
Bob used OpenTelemetry to instrument his app for distributed tracing:
const tracer = require('@opentelemetry/api').trace.getTracer('example-app');
const span = tracer.startSpan('http_request');
span.end();
"With traces, you can see exactly where your system is slowing down," Josie added.
If you're not already using tools like Loki, Grafana or Open Telemetry, don't worry! We'll cover these in a separate article on setting up a robust observability stack.
Combining the Pillars
Josie helped Bob combine all three pillars into a cohesive observability setup:
- Metrics showed a spike in latency
- Traces pinpointed the backend service causing delays
- Logs revealed a misconfigured database query
"Observability isn’t just about finding problems," Josie said. "It's about understanding your system deeply."
Putting it all together
To illustrate, Josie walked Bob through a real-world scenario:
- Problem Detected: Metrics showed an increase in request latency
- Root Cause Found: Traces revealed a bottleneck in the backend
- Issue Confirmed: Logs identified an outdated library causing the slowdown
"Without observability, you'd be shooting in the dark" Josie said.
Bob reflected on what he’d learned, jotting down notes:
- Logs capture granular details for debugging
- Metrics provide a high-level view of trends
- Traces link everything together, revealing root causes
- Observability is critical for proactive problem detection, optimisation, and security
Josie smiled. "With these tools, you can uncover hidden threats and keep your cluster running smoothly. You can also deploy confidently, knowing that any issues can be quickly identified and addressed."
"What's next?" Bob asked eagerly.
"Well, now that you can observe your cluster's behaviour, the next step is to ensure your workloads are actively protected against real-time threats" Josie responds.
